
ADR
B2B DESKTOP APP | CYBER SECURITY
BACKGROUND
AUG 24 - JAN 25 | PRODUCT DESIGNER
Guardz is an all-in-one cybersecurity platform for MSPs, offering automated threat detection, response, and protection across endpoints, cloud apps, email, and identity — while enabling MSPs to monitor and manage multiple customers from a single dashboard.
Guardz ADR is an automated threat detection and response solution that connects the dots across multiple security domains. Designed for MSPs, it identifies related alerts, surfaces incidents, and guides effective remediation, reducing noise and enabling faster, more informed action.
THE PROBLEM
When random alerts aren’t so random
Security alerts often appear in isolation - a suspicious login here, a phishing email there - and can easily be dismissed as low-risk or unrelated. But these seemingly random events are often part of a larger, coordinated attack. Without a system that connects these signals across domains, critical threats go undetected until it’s too late. For MSPs juggling multiple clients, the stakes are even higher: missed connections mean missed breaches.
COMPETITOR ANALYSIS
Competitors rely on people, not scale
As we explored how others in the cybersecurity space tackle this challenge, we found that many rely on Managed Detection and Response (MDR) — a service-heavy approach that combines technology with human expertise. Typically, MDR includes:

While effective for large enterprises, this model doesn’t scale easily for MSPs managing multiple small businesses. It often requires dedicated SOC teams, creating cost and operational barriers that many MSPs can’t sustain.
This gap led us to develop ADR — an automated, scalable approach to detection and response, purpose-built for the needs and constraints of MSPs.
THE SOLUTION
Our approach:
automated detection and response (ADR)
ADR delivers the same core value as MDR — identifying threats and guiding response — but reimagined for scale, speed, and usability. Instead of relying on human analysts, ADR uses automation and smart context to empower MSPs to act faster and more efficiently. Key differentiators include:

MVP DESIGN
Starting with structure: incident view
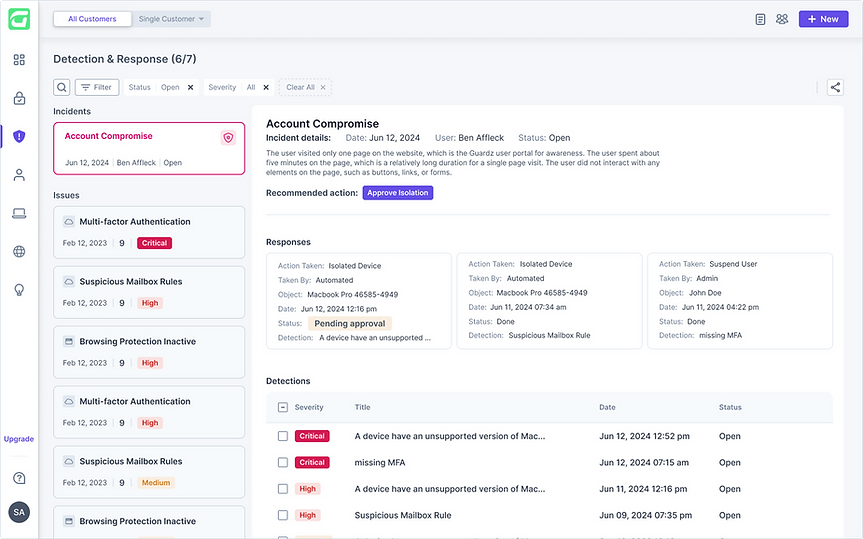
The first version of the Incident View focused on completeness. We included a detailed table showing all related detections and responses in reverse chronological order, alongside key incident data. While accurate and thorough, users found the table too dense and hard to scan quickly — especially in urgent situations.

USABILITY
When speed matters, tables fall short
User testing revealed that while the table was thorough, it didn’t support fast decision-making. Users found it hard to scan, too focused on raw data, and lacking a clear sense of what happened - and when. This feedback pushed us to rethink how incident timelines should be visualized.

UX APPROACH
Overview at a glance
Based on user feedback, we realized the design needed to support faster comprehension, not just data completeness. This led us to shift toward a visual-first approach, focused on surfacing meaning at a glance. We centered the experience around:

ITERATIONS
What didn’t work - and why
Finding the right way to visualize incidents took time. We explored three different timeline approaches, each attempting to address clarity and speed — but each fell short in key ways. These iterations helped us understand what our users truly needed and brought us closer to the final solution.
Attempt 1: separating responses from incidents
In this version, we separated responses from detections — keeping detections in a table and surfacing responses above them as visual cards with key details.
-
Clear event type separation
-
Stronger hierarchy for responses
-
Response source visible (admin vs. system)
-
No chronological flow
-
Broken connection between events
-
Still too slow to read and interpret
Attempt 2: timeline in a drawer
We added a timeline drawer alongside the table and cards to offer an optional visual view.

-
Clear chronological flow
-
Icons and colors helped distinguish event types
-
Easier to scan than a table
-
Info split across the main view and drawer
-
Event relationships still unclear
-
Text-heavy details slowed comprehension
Attempt 3: visual timeline
We replaced the detailed table with a simplified visual timeline. Since full event data is available in drawers, the timeline focuses on clarity and flow — not raw detail.

-
Quick to scan and understand
-
Minimal cognitive load
-
Clear separation between detections and responses
-
No visual links between related events
-
Lacked time scale or duration cues
FINAL DESIGN & FLOW
Setting the stage
ADR is activated from the “Security Controls” page, where it’s positioned as the first control and visually highlighted to reflect its critical role. Once activated, users can customize the default automations to fit their needs.
Incident alert on the dashboard
The first page users land on is the dashboard. When an incident is active, a prominent, high-visibility banner appears at the top - signaling that action is required. This banner persists across the entire platform until the incident is resolved, ensuring that critical issues stay front and center no matter where the user navigates.

Incidents are always shown first
The “Detection & Response” page serves as a second entry point for managing incidents. When incidents are present, they appear prominently at the top of the page — above the grouped detections — ensuring immediate visibility and prioritization. This design helps users distinguish between isolated events and correlated threats, guiding them to what matters most. Hovering reveals a summary of how the incident unfolded, and clicking opens the full incident view while keeping the context accessible.

The final timeline:
clarity, context, and confidence
The final incident view centers around a clean, horizontal timeline that surfaces only what matters: the order, type, and relationships between events. Detections and responses are visually distinct, with subtle indicators for ownership and status. Users can click into any event to open a detailed drawer — providing full context and remediation actions without cluttering the main view. This design balances speed and depth, helping MSPs understand and respond with confidence.


Closing incidents
Once the user approves a suggested action, it’s immediately reflected on the timeline — maintaining real-time accuracy. The main CTA then moves forward, guiding the user through the next remediation step. After all actions are taken, the user can close the incident, freezing the timeline for future reference and investigation. From there, they can generate a comprehensive report summarizing the full incident flow in a clean, shareable PDF.
KPIS
Impact by the numbers
Within just three months of launching ADR, we saw strong adoption and meaningful impact — from faster detection and response times to improved automation coverage and business results.
Recognition
Guardz was named a 2025 Market Innovator for MDR at the Global Infosec Awards, validating the broader impact of the platform and its ADR feature.
